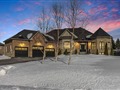
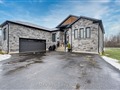
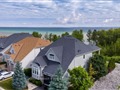
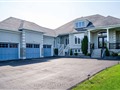
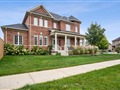
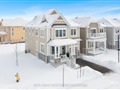
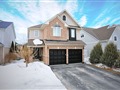
11 Langevin Dr
$1,037,545
Comparative Market Analysis
Jun 6, 2025
NOT AN ACTIVE LISTING
Historical Performance
| Period | $ Change | % Change |
| 1 Day | +$367 | +0.035% |
| 7 Days | +$348 | +0.034% |
| 30 Days | -$1,766 | -0.170% |
| 3 Months | -$4,055 | -0.389% |
| 6 Months | +$13.8k | +1.35% |
| 1 Year | -$53.9k | -4.94% |
| 3 Years | +$408k | +64.9% |
| 5 Years | +$493k | +90.4% |
| 10 Years | +$694k | +202% |
List My Property
Real Estate Statistics
Financing Solutions
AS SEEN ON


Are You a Licensed Real Estate Agent or Broker?